Turn your data into winning decisions
Everything that you track on your projects can be included in detailed reports and dashboards.
Make better, faster decisions on projects
With ProjectTeam.com reporting, you will spend less time building reports in spreadsheets and more time accurately answering your business’s strategic questions.
Real-time data analytics
Reports and dashboards in ProjectTeam.com give you real-time insight into how each process within your organization is performing. In ProjectTeam.com you can:
- Run pre-built standard reports
- Easily build custom reports using any data
- Group, sort, and filter your data


Highlight critical processes with dashboards
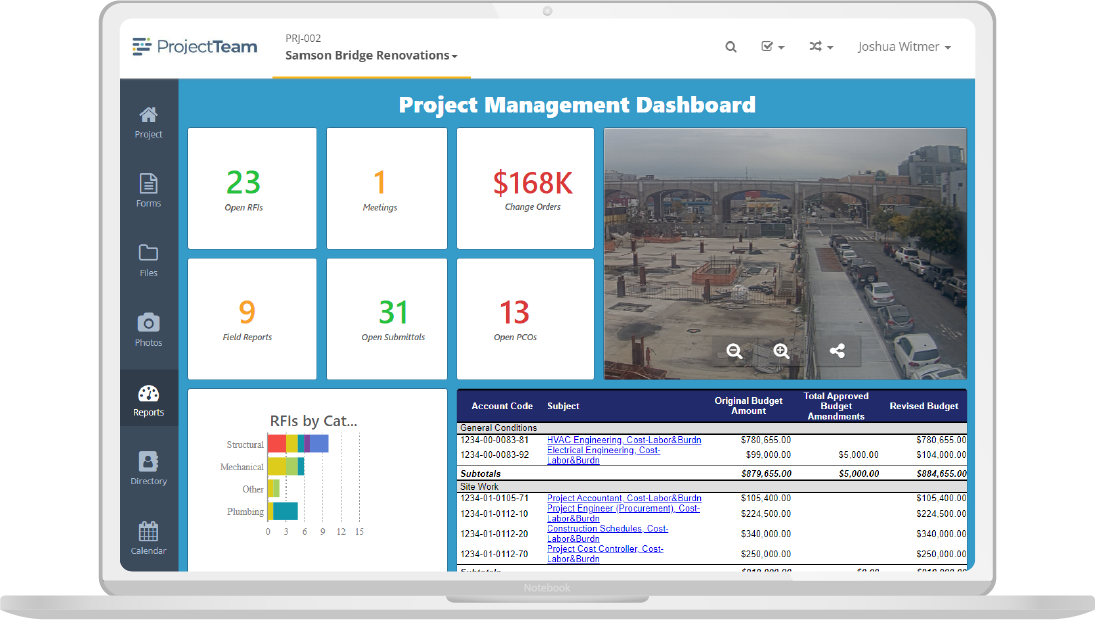
Drag-and-drop tiles of information such as charts, KPIs, reports, images, and videos to create dashboards. In ProjectTeam.com you can:
- Click on data to drill down on information
- Customize your dashboards with tiles
- Share dashboards with other users
Set up automated processes to send important reports
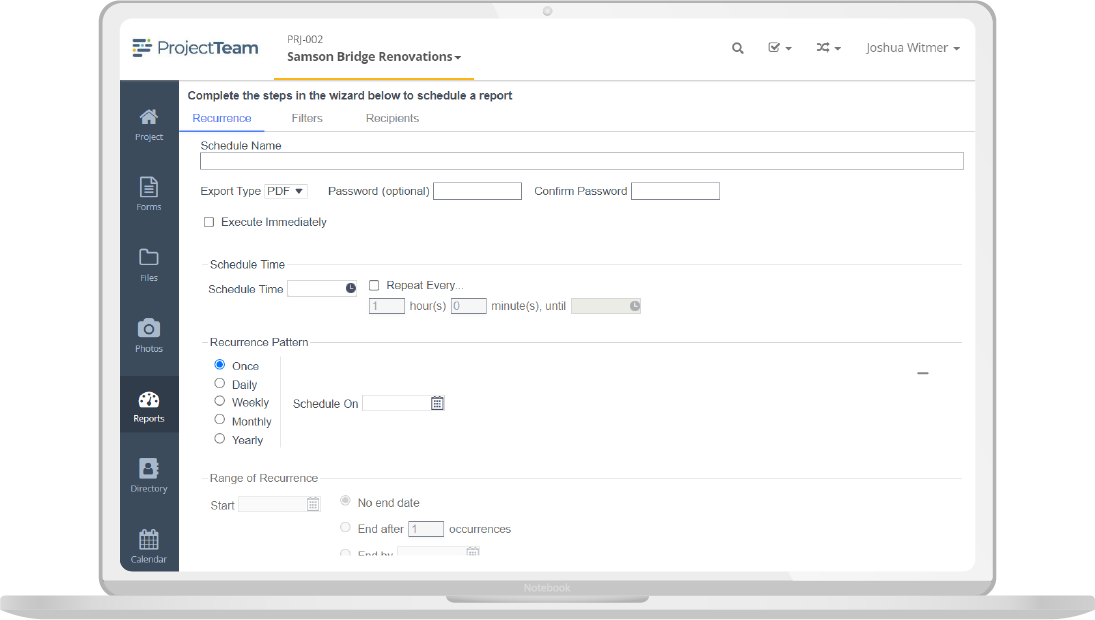
For reports that you run often, set up a schedule to automatically send the reports to any email address on any recurring day & time. In ProjectTeam.com you can:
- Chain multiple reports into a single output
- Export and send reports in PDF, Excel, Word, or CSV
- Manage all of your scheduled reports in one view

Unlock the power of robust reporting tools
ProjectTeam.com reports and dashboards give you deep insights into the overall health of your organization and projects. Any data you track in ProjectTeam.com can be included in easy-to-create reports and dashboards.
Standard reports
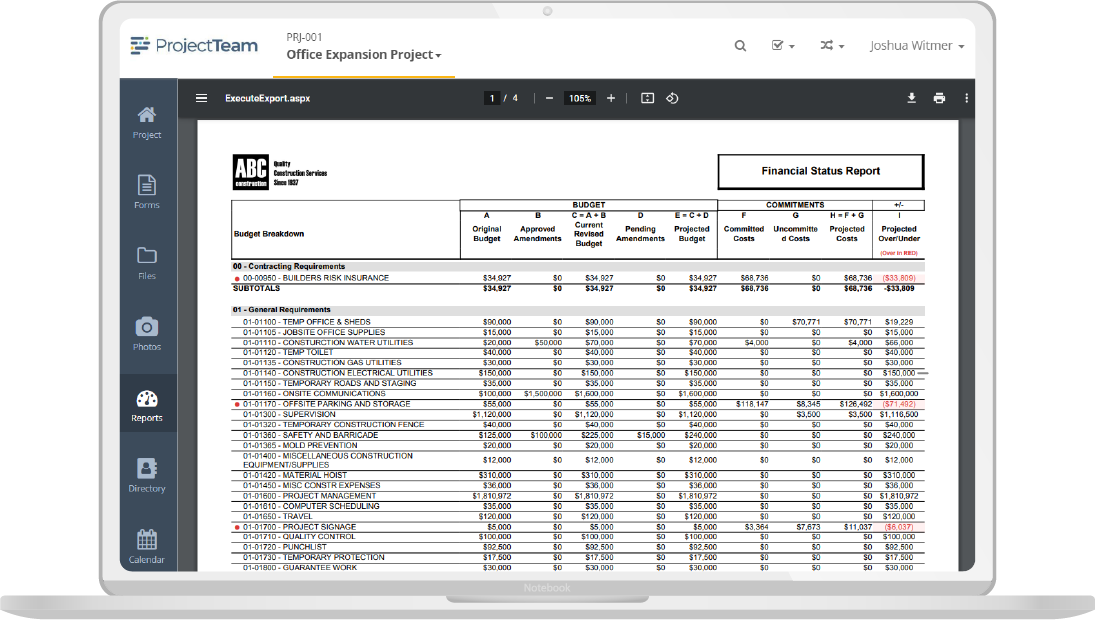
You can run pre-built reports on day one of using ProjectTeam.com. You have access to an expanding list of reports including reports for forms, projects, financials, and more.
Export your data
Any report you have in ProjectTeam.com can be exported to file types including PDF, Excel, RTF, and CSV. All styles and formatting are maintained in your export.
Data security & permissions
The permissions you set within your projects carry forward to all reports and dashboards you create guaranteeing only the appropriate users have access to the data.
Unlimited customization
There is no limit to the number of reports you can build in ProjectTeam.com. When creating a new report, you decide which data to include and who should have access.
Add visualizations
Add visualizations such as bar charts, pie charts, line graphs, and others to your reports. For each visualization you can customize titles, legends, and colors.
Drag and drop
The reporting tools available in ProjectTeam.com are built to be easy to use. Even the least technical users can create informational reports and dashboards in minutes.
Real-time data
When data is updated in ProjectTeam.com it is immediately available in the reporting tools. Even custom fields added can be used in your reports.
Custom branding
Add your organization's logo and brand elements to your reports, dashboards, and print layouts. Make pixel-perfect adjustments to reinforce your brand identity.